Deciphering Blackjack's Core Mechanics Through Simulated Multi-Round Sequences and Outcome Distributions
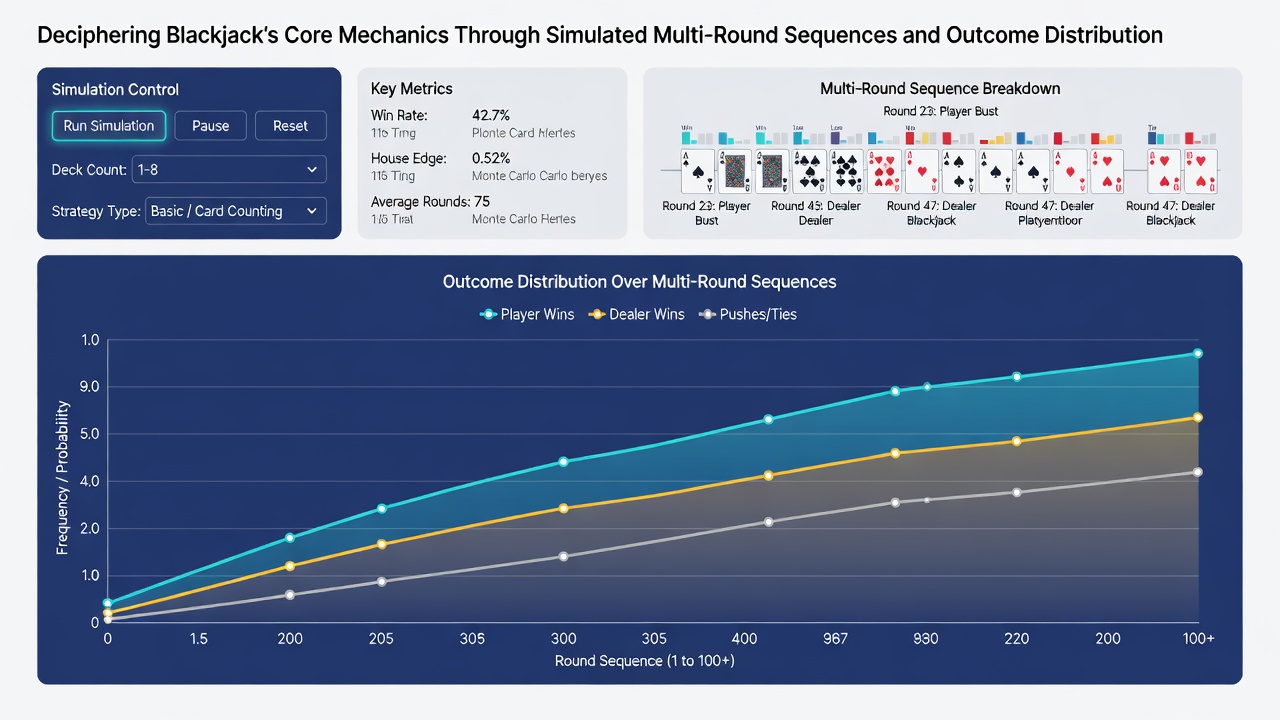
Blackjack simulations model the game's fundamental rules across thousands of hands to map how decisions like hitting, standing, doubling, and splitting interact with random card draws from finite or infinite decks. Researchers run these sequences using random number generators calibrated to standard rules, where the dealer hits on soft 17 in many variants while players aim to reach totals closer to 21 without exceeding it. Data from such models shows the baseline house edge hovering near 0.5 percent under optimal play conditions according to analyses from the Nevada Gaming Control Board.
Core Mechanics in Simulated Play
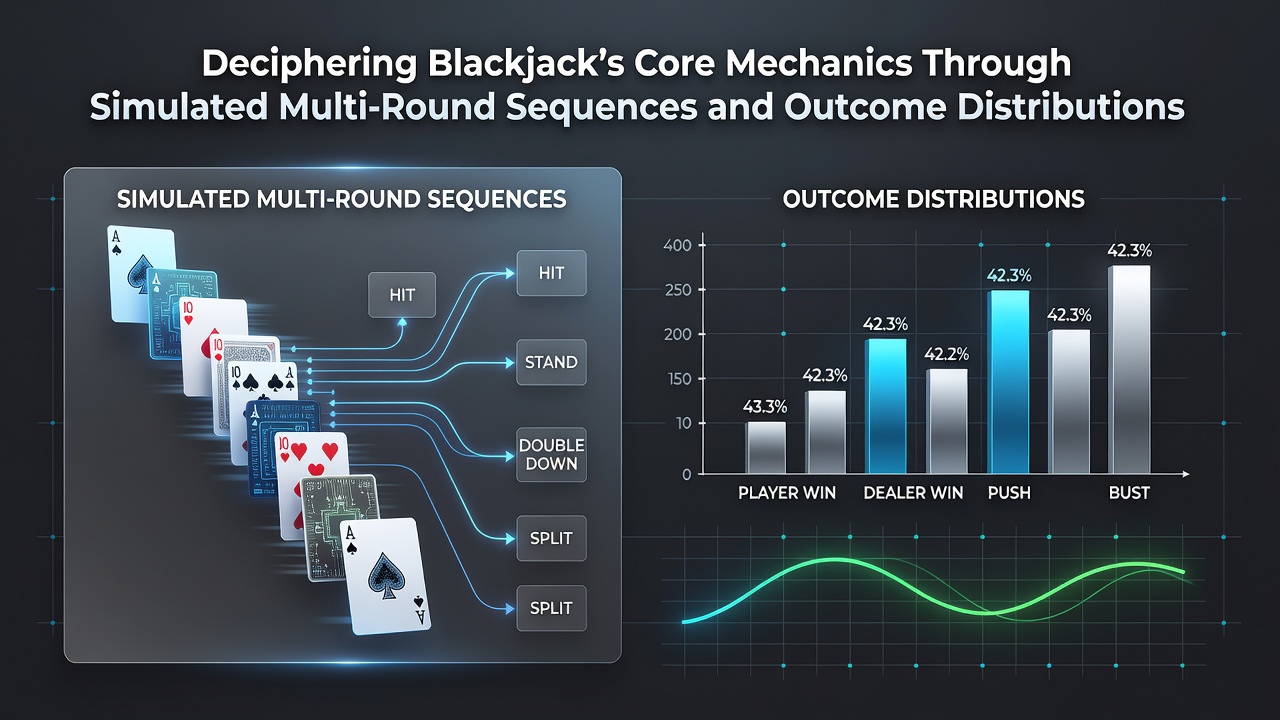
Each round begins with two cards dealt to the player and dealer, one dealer card hidden until the player's actions conclude, and simulations replicate this flow repeatedly to isolate variables such as deck penetration and reshuffle points. Observers note that basic strategy charts emerge directly from these runs because they calculate expected values for every possible hand combination against each dealer upcard, producing tables that minimize losses over time. Multi-round sequences add layers by tracking carryover effects like running counts in shoe games, although pure mechanics focus on isolated decisions rather than advanced techniques.
Simulations handle edge cases through exhaustive enumeration for smaller decks and Monte Carlo methods for larger ones, revealing patterns in bust rates and push frequencies. For instance, the probability of a dealer bust when showing a 6 stands around 42 percent across standard eight-deck setups, a figure confirmed through repeated trials that mirror live table conditions without requiring physical cards.
Multi-Round Sequence Modeling
Extending simulations beyond single hands requires chaining outcomes while preserving deck state between rounds until a shuffle intervenes, which allows analysts to examine streak behaviors and recovery patterns after losses. Software tools process batches of 100,000 or more consecutive rounds to generate reliable statistics on win rates per unit bet, showing how variance compounds when players maintain fixed bet sizes across sessions. Those who study these sequences find that short-term fluctuations often mask the long-term convergence toward theoretical expectations, a result documented in peer-reviewed work from the Journal of Gambling Studies.
Key parameters adjusted in these models include the number of decks, rules for splitting aces, and surrender availability, each tweak altering the distribution tails where extreme outcomes cluster. In June 2026 updates to simulation platforms incorporated faster parallel processing, enabling researchers to test rule variations across millions of hands in minutes rather than hours.
Outcome Distributions and Statistical Insights
Outcome distributions from these sequences typically follow near-normal shapes centered on the expected value, yet display fat tails from rare events like multiple blackjacks or dealer 21s in succession. Histograms generated by the models illustrate the spread of session results, with standard deviation per hand often cited near 1.15 betting units under basic strategy. This spread explains why even skilled players experience extended drawdowns, as the models quantify the frequency of negative excursions lasting dozens of rounds.
Further runs break down results by bet size categories and rule sets, producing cumulative distribution functions that help compare variants without live testing. Data indicates that doubling on hard 11 yields positive expectation in roughly 70 percent of cases against dealer upcards from 2 through 10, a breakdown that emerges consistently when thousands of matching scenarios are aggregated.
Applications of Simulation Data
Industry groups such as the American Gaming Association reference simulation outputs when evaluating table rule changes, since the models predict shifts in player hold percentages with high precision. Academic teams apply similar methods to study player behavior under fatigue or time pressure by embedding decision delays into the sequence logic, though core mechanics remain the focus. One study from researchers at the University of Sydney examined how altering penetration depth from 75 to 85 percent affected overall return distributions across 500,000 simulated shoes.
Software outputs also feed into training modules that let users replay specific sequences where deviations occurred, highlighting moments when basic strategy would have altered the final tally. These tools maintain objectivity by logging every random seed and action for later verification, ensuring reproducibility across different computing environments.
Conclusion
Simulated multi-round sequences continue to serve as the primary method for mapping blackjack outcome distributions because they scale efficiently while preserving exact rule fidelity. Aggregated results from such work provide the numerical foundation for strategy resources and regulatory assessments alike, with ongoing refinements in computational speed promising even finer granularity in future models.