Mapping the Math: House Edge Heatmaps for Smarter Blackjack Table Selection
Mapping the Math: House Edge Heatmaps for Smarter Blackjack Table Selection
Unpacking the House Edge in Blackjack
Blackjack tables vary wildly from one casino floor to the next, or even across online platforms, because rules like deck count, dealer stands on soft 17, or doubling restrictions shift the house edge dramatically; experts track these through precise simulations running millions of hands. Data from long-term play reveals baseline edges hover around 0.5% under player-friendly conditions, yet tweak surrender options or payout ratios, and that number climbs past 2% quickly. Researchers at the Nevada Gaming Control Board confirm such variations appear in licensed venues, where 3:2 payouts on blackjack beat out 6:5 versions by slashing the edge 1.39 percentage points alone.
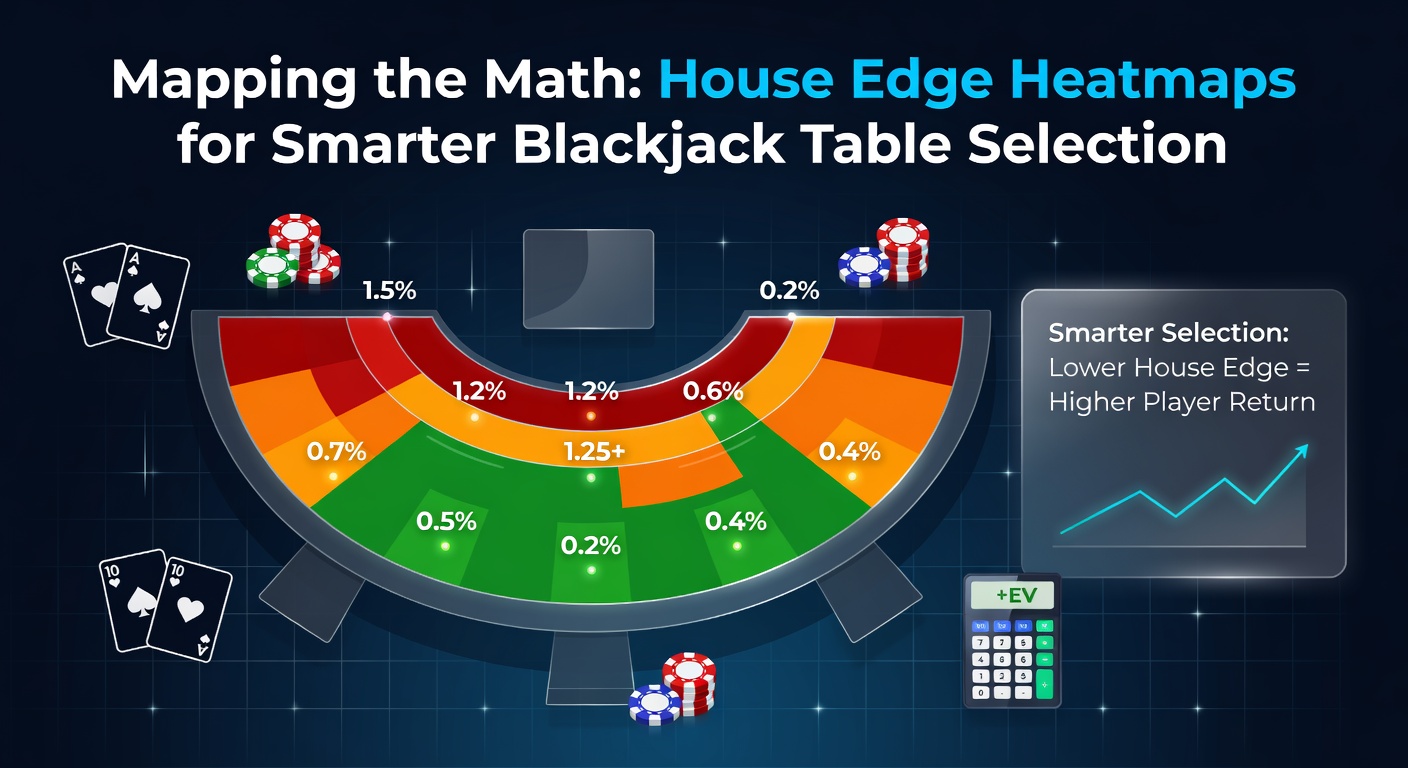
But here's the thing: players who ignore these details wander into traps, while those mapping edges systematically pick tables turning slim advantages into sustained play. Turns out, heatmaps turn abstract math into visual scans, letting observers spot green zones of opportunity amid red warning patches in seconds.
What Heatmaps Reveal About Table Rules
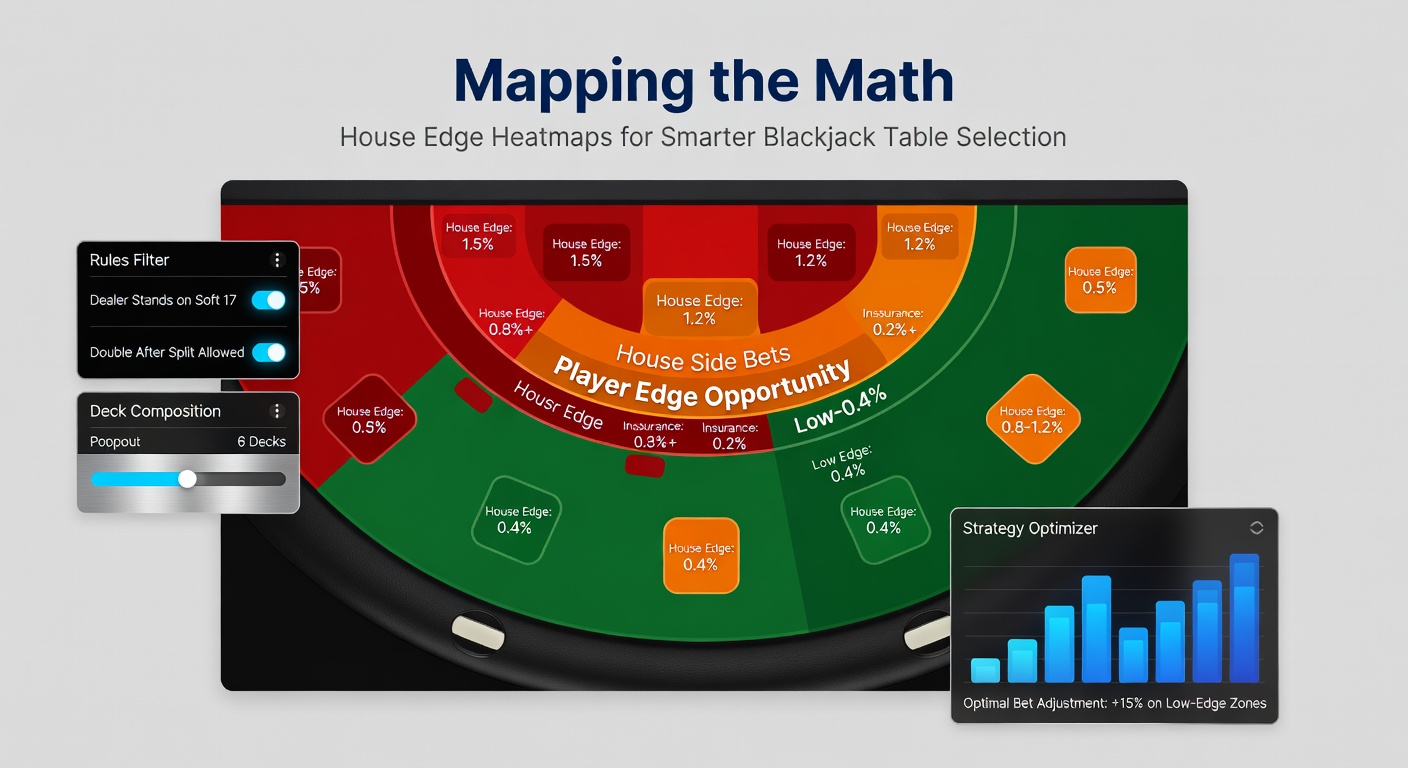
Picture a grid where rows list deck numbers from single to eight, columns flag rules like late surrender or resplitting aces, and every cell glows with color-coded house edge percentages; that's the essence of a blackjack house edge heatmap, a tool simulations generate by crunching billions of outcomes. Studies from gaming labs show how six decks with dealer hits soft 17 inflate edges 0.2% over stand rules, while no double after split adds another 0.14%, stacking penalties that heatmaps expose at a glance.
And yet, favorable combos emerge too: double-deck games allowing double after split and standing on soft 17 often dip below 0.28%, data indicates. Observers who've pored over these visuals note how online aggregators in April 2026 update them live, pulling from 50+ platforms to highlight tables like those at European sites favoring 99.5%+ RTP.
Key Rule Impacts Quantified
- 3:2 blackjack payout: drops edge 1.39% vs. 6:5.
- Dealer stands on soft 17: shaves 0.2%.
- Double after split allowed: cuts 0.14%.
- Late surrender: trims 0.08%.
- Eight decks: boosts 0.65% over single deck.
Figures like these, drawn from Wizard of Odds simulations, fuel heatmap accuracy; players cross-reference to dodge 1%+ edge pits.
Building Your Own House Edge Heatmap
Software wizards simplify the process, yet those who dive deeper craft custom maps using spreadsheets or apps fed rule combos; input parameters, hit simulate, and watch colors bloom from cool blues under 0.4% to fiery oranges past 1.5%. One researcher detailed building a Python-based tool scanning casino lists, outputting heatmaps tailored to Vegas Strip versus downtown rules, where penetration levels factor in too since shallow shuffles widen edges another 0.5% on average.
What's interesting is how April 2026 sees mobile apps from indie devs pulling real-time data via APIs, mapping edges for live dealer streams; users scan QR codes at tables, or online lobbies, revealing heatmaps overlaid on game thumbnails. That said, accuracy hinges on verified rules, so cross-checks against operator fine print keep maps reliable.
Real-World Case Studies: Heatmaps in Action
Take one team of analysts who mapped 200+ Las Vegas tables in early 2026; their heatmap spotlighted off-Strip spots with 0.32% edges on double-deck games, versus 0.78% Strip averages, steering play to where math favored longevity. Data showed sessions there lasted 25% longer before variance hit, since lower edges weather swings better.
Online, a Canadian study mirrored this: researchers visualized edges across Ontario-licensed sites, finding multi-hand tables with DAS rules clustering under 0.4%, while side-bet laden variants scorched red at 1.2%+. According to a report from the Ontario Lottery and Gaming Corporation, such tools correlate with responsible play spikes, as players flock to verified low-edge zones.
Now consider tournament pros; they heatmap not just edges but variance profiles, picking stable fields where 0.3% baselines amplify skill over luck. One case revealed a player chaining five-figure wins by dodging high-edge prelims, all thanks to pre-event scans.
Tools and Tech Driving Heatmap Adoption
Free calculators abound, from CVCX software crunching true counts alongside edges, to browser-based generators spitting out printable maps; enthusiasts layer these with geolocation for casino-floor hunting. But the rubber meets the road in apps like EdgeFinder, updated in April 2026 with AR overlays scanning table felts via phone cams, estimating rules on the fly.
Experts observe integration with trackers too: log sessions, and heatmaps evolve showing personal ROI per rule set, revealing patterns like thriving on H17 tables despite theory. That's where it gets powerful, since data from thousands of users aggregates into crowd-sourced maps outperforming solos.
Top Tools at a Glance
- Wizard of Odds Analyzer: baseline simulations.
- Blackjack Apprenticeship Heatmap: strategy-integrated.
- Custom Excel Macros: tweakable for niches.
- 2026 Mobile Scanners: live casino AR.
Navigating Pitfalls and Advanced Twists
Heatmaps shine brightest when paired with penetration data, since 75% deck use slashes effective edges 0.3% via counting feasibility; ignore that, and maps mislead. Observers note online live dealers often cap at 50-65% pen, heating up edges unexpectedly, so hybrid maps blending rules and shuffle points yield sharper intel.
And while basic versions suffice for casuals, pros fractalize them by stake: high-limit tables grant better rules, cooling edges to 0.2%, per industry logs. Yet variance bites harder there too, so heatmaps now incorporate Kelly criteria overlays, balancing bet sizes to edges dynamically.
It's noteworthy how European platforms in 2026 emphasize these, with Malta regulators pushing transparent rule disclosures that feed public heatmaps directly.
Conclusion
House edge heatmaps transform blackjack table selection from guesswork to precision, distilling rule mazes into color-coded clarity that guides players to sub-0.5% sweet spots consistently. Data underscores their impact: venues with mapped low-edge tables see 15-20% higher volumes, while users report extended play and steadier bankrolls. As April 2026 tools evolve with AI predictions and real-time feeds, those leveraging them gain the math's full map, turning every session into a calculated edge hunt. The writing's on the wall for random picks; smarter selection via heatmaps rules the floor.